Artificial Intelligence and Machine Learning · Lecture 10 of 16

Regression · Part 2

Uncertainty, inference and interpretation

Explain how fitted models vary, quantify uncertainty, and interpret associations without confusing them with causal effects.

01Bias–variance trade-off
02Accuracy of estimates
03Multiple linear regression
04Assumptions
Regression · Part 2

From fitted predictions to uncertainty and interpretation

A fitted line is an estimate. What changes across samples, and what may we conclude?

01 · Bias–variance trade-off

Repeat training on new samples

02 · Accuracy of estimates

Quantify slope uncertainty

03 · Multiple linear regression

Interpret conditional comparisons

Recap · Before bias–variance

Five metrics: what does each one tell me?

MetricFormulaWhat does it show me?
RSSResidual sum of squares∑i=1nri2Training misses, squared and added. Smaller means a closer fit to the same cases.
TSSTotal sum of squares∑i=1n(yi−y¯)2Squared misses from always predicting the response average: the variation available to explain.
RSEResidual standard errorRSSn−qEstimated scatter around the fitted model, in response units (such as kg).
R²Coefficient of determination1−RSSTSSImprovement over the average baseline: 1 = perfect, 0 = equal, negative = worse.
Test RMSERoot mean squared error1ntest∑i=1ntest(yi−yˆi)2Typical size of mistakes on new test cases, in response units. Large misses count more.
ri=yi−yˆi = one prediction’s miss
yi = observed response, yˆi = prediction
y¯ = response mean used for TSS.
n = training count, ntest = test count
q = independent fitted coefficients, including the intercept
For a line q=2. RSE needs n>q. R² needs TSS>0.
01 · Bias–variance trade-off

Train again on new data: does the prediction move?

Each dot is a model’s prediction for the same input, after training on a different sample.
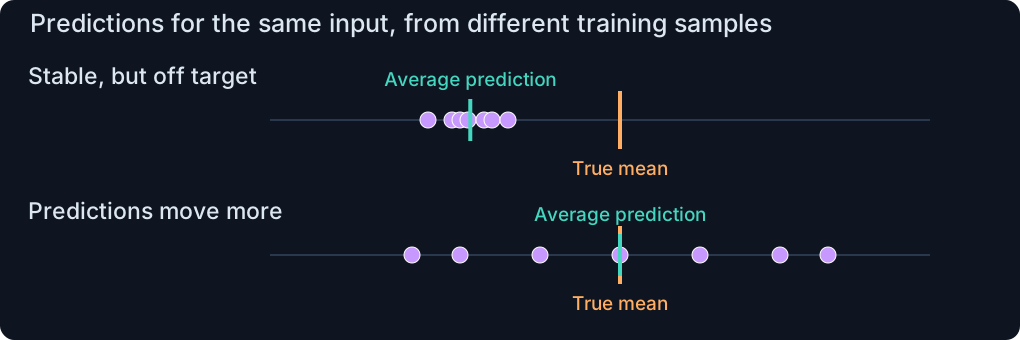
Repeated fitted predictions can have an off-target average or a wide spread
Bias: is the average on target?

Bias is the systematic error from a mismatch between the average learned relationship and the true one.
Example: a straight-line model misses a quadratic pattern.

Variance: how much do predictions move?

Variance is the variability of the learned model across possible training datasets from the same population.
Here, compare the spread of predictions at the same input.

01 · Bias–variance trade-off

Bias measures the average miss; variance measures instability

Keep input x fixed and repeat training on possible datasets 𝒟 from the same population.

Bias: the average prediction’s miss
Bias(f(x;𝒟))=𝔼𝒟[f(x;𝒟)]−𝔼ε[y]

Average learned prediction minus the true mean.

Variance: changes across training samples
Var(f(x;𝒟))=Var𝒟[f(x;𝒟)]

Spread of learned predictions at the same input.

𝒟 = one possible training dataset
f(x;𝒟) = prediction after training on 𝒟
x = the same input in every comparison.
𝔼𝒟 = average across training datasets
Var𝒟 = variance across those datasets
𝔼ε[y] = true mean response at x
y = a new, unseen response, ε = its random error.

New observation: y is an outcome not used for training. Its ε is the random difference from the true mean at x. For example, another crop trial with the same fertilizer dose can give a different yield.

01 · Bias–variance trade-off

Expected MSE = squared bias + variance + noise

At the same input x, imagine training again and predicting a new observation y. Average the squared prediction errors over these repetitions.

𝔼𝒟,ε[(y−f(x;𝒟))2]=[Bias(f(x;𝒟))]2+Var(f(x;𝒟))+Var(ε)

The sum on the right is the expected Mean Squared Error (MSE).
MSE is RMSE without the square root: RMSE=MSE.

Model-dependent part

Squared bias: how far the average prediction misses.
Variance: how much predictions change across training datasets.

Irreducible noise for these inputs

ε is the new observation’s random difference from its true mean.
This variation remains even if we predict that mean perfectly.

x = fixed input, y = new, unseen response
𝒟 = training dataset
f(x;𝒟) = prediction learned from that dataset.
𝔼𝒟,ε = average over datasets and new observation noise
ε = new observation noise, independent of 𝒟
𝔼ε[ε]=0 means zero mean error.

The simulation knows the true curve. With real data, compare validation error because the true bias and variance are usually unknown.

01 · Bias–variance trade-off

See bias and variance at the same input

Compare degrees 0, 2 and 9. Purple dots show 60 fitted predictions. The blue dotted line marks the selected input x.

The simulation knows the true curve. With real data, compare validation error because the true bias and variance are usually unknown.

01 · Bias–variance trade-off

Fit on training data → choose on validation → assess on test

Each dataset has a different job. Example scores below are illustrative: lower RMSE is better.

1 · TRAINING SET

Fit the candidates

━ Degree 2━ Degree 9

Learn the coefficients of both curves from the same training cases.

2 · VALIDATION SET

Choose the degree

Validation RMSE ↓Degree 20.32 ✓Degree 90.58

Predict different, held-out cases.
Lower validation error → choose degree 2.

3 · TEST SET

Assess the chosen model

Degree 2 selectedTest RMSE: 0.35One final assessment

Predict a third, untouched set.
Report how well the chosen model generalizes.

Choose before testing. If a test score makes you change the model, that set is now guiding selection.

02 · Accuracy of estimates

A nonzero fitted slope can still reflect sampling noise
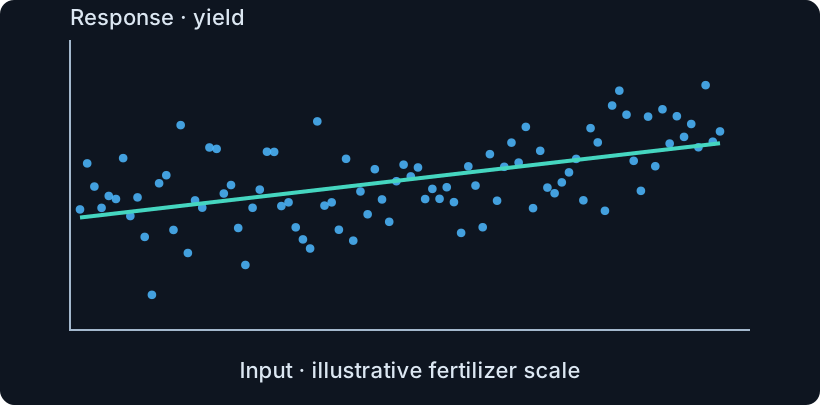
The 90 observations and their OLS fitted line
One sample gives one estimate

The fitted slope here is about 0.108. Another sample could give a different value.

The question: would a slope this far from zero be unusual* if the true population slope were zero?

A fitted number alone does not tell us how precise it is. We need its sampling uncertainty.

*Here, “unusual” means “unlikely to arise from sampling noise if the true population slope were zero.”

02 · Accuracy of estimates

A slope test asks about linear association

A fitted slope can be nonzero just because the sample is noisy. We state two hypotheses to check whether the data provide evidence of a linear association beyond this sampling variation.
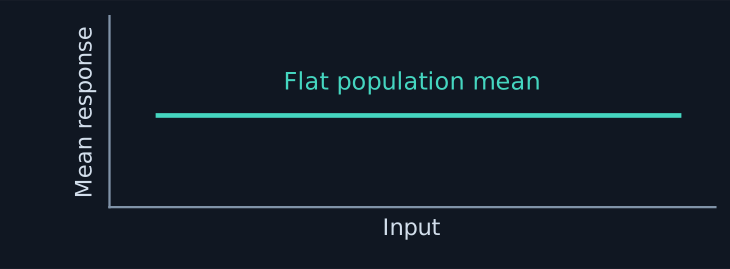
Null hypothesis
H0:β1=0
Null hypothesis: the population mean response is flat as the input changes.

The population slope is zero. A nonzero fitted slope can arise from sampling noise.
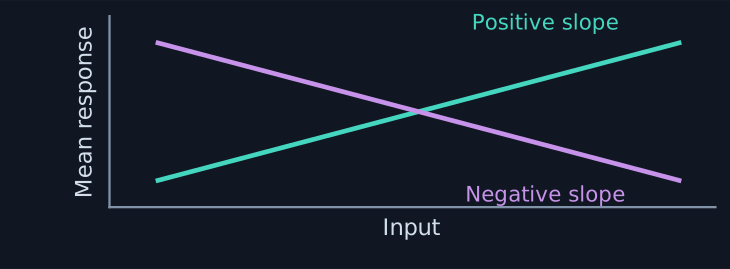
Two-sided alternative
H1:β1≠0
Two-sided alternative: possible population mean lines with a positive or a negative slope. These are two alternatives, not two lines fitted together.

The population slope is positive or negative. The data may support a linear association.

Rejecting H₀ does not establish causation. Failing to reject does not establish no relationship.

β1 = unknown population slope
βˆ1 = its sample estimate.
H₀ = zero-slope null hypothesis
H₁ = two-sided alternative.
02 · Accuracy of estimates

Two different spreads: response scatter and slope uncertainty

RSE · Residual Standard Error

How scattered are the responses?

One fitted line, blue observed responses, and purple vertical residual gaps

Use one dataset. RSE estimates the size of the random scatter around its fitted line.

Units: response units, such as kg.

Slope SE · Standard Error of the Slope

How much does the fitted slope change?

Three lines fitted to different datasets, followed by a numbered axis with 20 slope estimates. Matching colors link the three lines to their slope estimates.

Repeat training on new datasets. Slope SE describes how much the slope estimates vary.

Units: response units per input unit.

02 · Accuracy of estimates

Repeated studies give different slopes: put them on one scale

This describes what fitted slopes would do across repeated studies. In ordinary data, the true β1 and the true σ are both unknown.

1 · Before: fitted slopes vary around the truth
βˆ1∼𝒩(β1,σ2)
An illustrative distribution of fitted slopes centered at 2, with one standard error of 0.4.

Center = β1. Spread = σ.

2 · Theoretical standardization
βˆ1−β1σ∼𝒩(0,1)
The same distribution after subtracting its center and dividing by its standard deviation: mean zero and standard deviation one.

Center = 0, spread = 1.
Computing this needs the true β1 and σ.

β1 = true population slope
βˆ1 = slope fitted to one sample
σ = true standard deviation of fitted slopes.
𝒩(0,1) = normal distribution with mean 0 and standard deviation 1
∼ means “has distribution”
Example: (2.4 − 2) / 0.4 = 1 standard error above the truth.

This theoretical quantity cannot be computed from the sample alone. A simulation can supply the true values. Next, estimate σ from data.

02 · Accuracy of estimates

Estimate how much the fitted slope would change

We estimate the slope standard error with σˆ. Press Next: equivalent formulas appear from left to right, while the explanation follows the selected step.

1 · Start with RSE
σˆ=RSE∑i=1n(xi−x¯)2

Think rise/run: RSE is vertical response noise. The denominator is horizontal input spread. Their ratio estimates slope uncertainty, not the slope itself.

2 · Substitute RSS
σˆ=RSS(n−2)∑i=1n(xi−x¯)2

Replace RSE² with RSS / (n − 2): two fitted coefficients use two degrees of freedom.

3 · Expand the residuals
σˆ=∑i=1n(yi−yˆi)2(n−2)∑i=1n(xi−x¯)2

Expand RSS into squared residuals. This is the same formula, written using the individual observations.

σˆ = SE(βˆ1): estimated spread across repeated studies.
A hat means estimated, not squared.
It is not the actual error βˆ1−β1 of this one fit.
RSE = response scatter. RSS = sum of squared residuals.
n = cases, i = case index.
xi = input, x¯ = input mean.
yi = response, yˆi = fitted response.
Smaller σˆ means less sampling variability. n−2 residual degrees of freedom.

More response noise increases slope uncertainty. More cases or more input spread reduce it, all else equal. Requires n > 2 and varying inputs.

02 · Accuracy of estimates

A new example: height and weight

We record height and weight for 16 people. Can a line summarize how average weight changes with height?

Each dot is one personAll 16 simulated height–weight observations, with height in centimetres and weight in kilograms. No fitted line is shown yet.
What have we measured?

Input: height, measured in centimetres.
Response: weight, measured in kilograms.

Four of the 16 observations:

Height (cm)Weight (kg)
15561.3
16874.6
18076.0
19591.2

Illustrative simulated data. The plot shows all 16 observations. Table values are rounded.

First look at the observations. Next, fit a line and ask how much evidence its upward slope gives.

02 · Accuracy of estimates

Why test a slope before trusting the upward trend?

The line fitted to these height–weight observations slopes upward. Is this evidence of a population linear relationship, or could sampling noise produce it if the true line were flat?

For the sample just shown, the fitted slope is 0.6 kg per cm. This sample estimate is not automatically the population slope.
1 · Start with the proposed flat line

Temporarily assume H0:β1=0.
This is the zero-slope population model.

2 · Imagine repetitions under that model

Use the same sampling setup.
Noise can make a fitted sample line tilt upward or downward.

3 · Compare our result with that reference

Would a fitted slope as far from zero as ours be unusual?
If very unusual, it is evidence against the flat population line.

We assess the observed result assuming a zero slope. We do not calculate the probability that the true slope is zero. A linear association does not establish causation.

Go to the next slide for a visual intuition

02 · Accuracy of estimates

The slope test: assume → repeat → compare

Imagine the population line is flat. What slopes could noise alone produce in samples like ours?
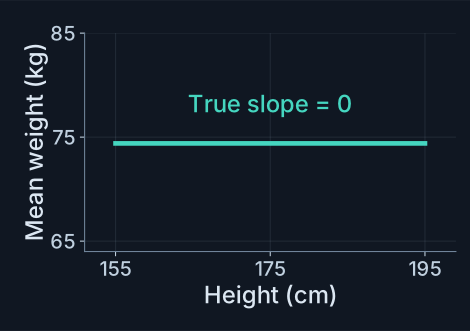
1 · Assume a flat population lineUnder the zero-slope assumption, population mean weight stays constant as height changes.

The true slope is temporarily set to zero. Individual responses can still be noisy.
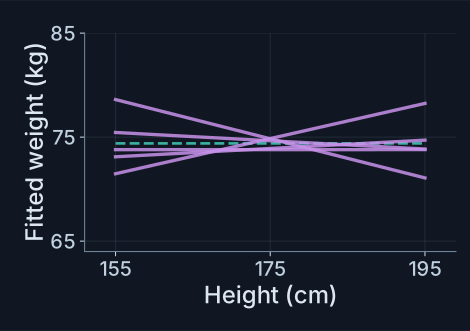
2 · Imagine repeated samplesFive lines fitted to hypothetical samples generated around the same flat mean. Their estimated slopes tilt upward or downward because of noise.

Keep the same 16 heights. Fit a new line to each hypothetical sample. Five of 500 fits are shown.
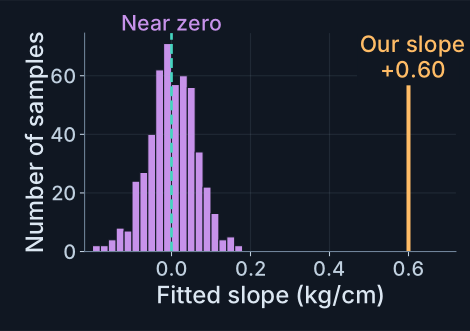
3 · Compare with our resultA histogram of 500 fitted slopes from hypothetical flat-model samples is concentrated near zero. The observed slope plus 0.60 kg per cm is marked far to the right in orange.

Purple bars summarize all 500 fitted slopes. Our +0.60 kg/cm lies far from their cluster.

The t test asks whether our fitted slope could plausibly result from sampling noise when the true population slope is zero.

t < 0
Negative fitted slope.
t = 0
Fitted slope equals zero.
t > 0
Positive fitted slope.

For a positive estimated standard error. The sign shows direction, not strength of evidence.

02 · Accuracy of estimates

The same fitted slope can give very different evidence

Two simulated adult height–weight samples: the same 16 height values, the same axis scales, and the same positive fitted slope. Only residual scatter changes.

Less vertical scatterSimulated adult height–weight data with fitted slope 0.60 kg per cm and estimated slope standard error 0.06 kg per cm.
βˆ1=0.60 kg/cm,σˆ=0.06 kg/cm,t=10

Less vertical noise gives a smaller slope SE. Dividing the same fitted slope by this smaller SE gives a larger positive t.

More vertical scatterSimulated adult height–weight data with fitted slope 0.60 kg per cm and estimated slope standard error 0.30 kg per cm.
βˆ1=0.60 kg/cm,σˆ=0.30 kg/cm,t=2

More vertical noise gives a larger slope SE. Dividing the same fitted slope by this larger SE gives a smaller positive t.

Slope SE also depends on sample size and horizontal input spread. Both are held fixed here, so this comparison isolates residual scatter. The t value is unitless.

02 · Accuracy of estimates

The t statistic measures how far the slope is from zero

The numerator asks: how far is our fitted slope from the zero slope proposed by H0? Divide that signed distance by its estimated standard error.

tobserved=βˆ1−0σˆ=βˆ1σˆ
βˆ1−0 = signed distance from the tested zero slope.
Positive above zero, negative below. Absolute value ignores direction.
The zero comes from H0, not from an estimate of the true slope.
βˆ1 = fitted slope, σˆ = estimated slope SE.
tobserved = value computed from our observed data.

The t value measures deviation from a hypothetical zero slope in estimated standard errors. It does not give the probability that the true slope is zero.

02 · Accuracy of estimates

A p-value compares our observed t with a zero-slope reference

Assuming the true line were flat, how rare would a t value at least as far from zero as ours be?

p-value=P(|T|≥|tobserved|∣H0)
1 · One result from our observed data
tobserved=2.2

Example: we compute this number once.
It is fixed by our original dataset.

2 · A random result in imagined studies
T

Assume H0:β1=0.
The same calculation on each hypothetical sample gives a new T.
Same model and sampling setup, not extra data to collect.

3 · Count results at least as far from zero
T≤−2.2orT≥2.2

Absolute values ignore sign.
The inequality counts both directions, including equally extreme results.

If the observed t is zero
tobserved=0⇒p-value=1

With a positive estimated SE, the fitted line is flat. Every possible |T| is at least 0.
This gives no evidence against a zero slope, but does not prove it.

Choose the threshold before inspecting the result

α = significance threshold (often 0.05, depending on the task).
p-value<α: reject the zero-slope null.
p-value≥α: insufficient evidence to reject it.

Smaller p means stronger evidence against a flat population line. “More extreme” means farther from zero in t units, not a larger raw slope. It is not the probability that the null is true.

02 · Accuracy of estimates

Explore the observed t and both probability tails

Change the observed t, n or threshold α. Try t = 0, switch its sign, or load the 90-point result. Watch the decision change as p crosses α.

The curve describes repeated studies under H0. A larger distance from zero leaves less probability in the two tails.

02 · Accuracy of estimates

Follow one complete test: fit, estimate uncertainty, compare

Start with the supplied data. Then simulate new samples: change their size, noise, true slope or input spread. Compare the OLS line with a mean-only fit.

02 · Accuracy of estimates

A confidence interval adds an uncertainty margin to the slope

Start with the worked 95% interval. Then repeat the study: each new dataset gives a new fitted slope and a new interval.

βˆ1±t0.975,n−2σˆ
βˆ1 = fitted slope, σˆ = estimated slope standard error
n = cases in each study. Every interval uses n − 2 degrees of freedom.
The t multiplier leaves 2.5% in each tail.
About 95% of intervals from repeated studies cover the fixed true slope.
That long-run rate does not require exactly 19 hits in every group of 20.
The simulation knows the true slope, so it can show which intervals miss.

This is an interval for the population slope, not for an individual future response. It does not establish causation.

03 · Multiple linear regression

One response can depend on several useful predictors
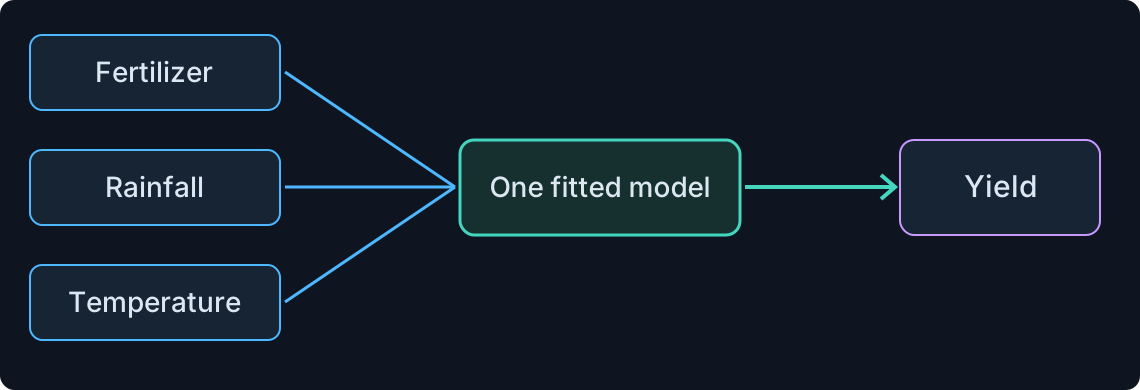
Fertilizer, rainfall and temperature enter one model predicting yield

Multiple linear regression combines several measured inputs in one prediction rule.

03 · Multiple linear regression

Several predictors, one response: fit their coefficients together

yi=β0+β1xi1+⋯+βmxim+εiyi=∑j=0mβjxij+εi
y=Xβ+ε
n = observations, i = case index
m = predictor count, j = predictor index
xᵢⱼ = input j for case i, with xᵢ₀ = 1.
yᵢ = observed response for case i.
βⱼ = coefficient for input j, β0 = intercept
εᵢ = random error for observation i
X has n rows and m + 1 columns.

y and ε stack the n responses and errors. β stacks m + 1 coefficients. Each row of X is [1, xᵢ₁, …, xᵢₘ].

03 · Multiple linear regression

Change one input while keeping the others fixed

A multiple-regression coefficient describes a comparison at the same values of the other included predictors.

Predicted yield=1+2F+.5R
Case A: F = 1, R = 4

Predicted yield = 1 + 2 × 1 + 0.5 × 4 = 5.

Case B: F = 2, R = 4

Predicted yield = 1 + 2 × 2 + 0.5 × 4 = 7.

F = fertilizer input, R = rainfall input
The example uses illustrative input and yield units.
Rainfall stays at 4. Raising fertilizer by 1 raises the model prediction by 2.
That is the meaning of the coefficient 2.

This is a model-based conditional association. A causal effect needs additional evidence about the study and mechanism.

03 · Multiple linear regression

Ice-cream sales and shark attacks: the regression result

Imagine recording ice-cream sales and shark attacks at different times of year. These illustrative values are normalized to show the pattern.
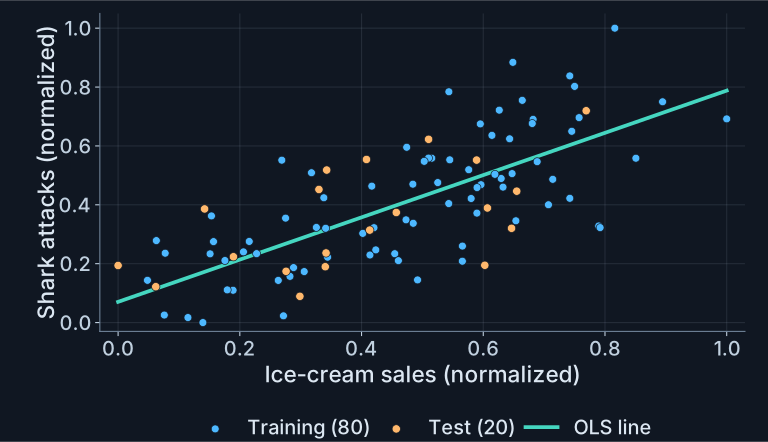
Predictor: sales → response: attacksThe original 80 training and 20 test observations of normalized ice-cream sales and shark attacks, with the upward OLS fitted line.
A tempting causal claim

“More ice cream must be causing the attacks!”

The line rises, R² ≈ 0.53, and the slope test gives p < 0.01. These support a linear association.

What can we actually conclude?

Sales and attacks vary together.
The regression alone does not explain why.

R²Coefficient of determinationRSEResidual standard errorTest RMSERoot mean squared errorSlope tTest statisticSlope p-valueTwo-sided test
0.53000.15250.14879.3792< 0.01
03 · Multiple linear regression

Correlation does not imply causation

In our example, ice-cream sales and shark attacks rise together. Should we arrest the ice-cream vendor?

The absurd conclusionOn a sunny beach, a two-scoop ice cream in a waffle cone says I plead delicious. A clearly drawn shark with a dorsal fin, gills and forked tail replies Don’t blame the sprinkles.
A possible common cause: hot weatherHot weatherMore ice-cream salesMore swimmingmore exposure to sharks

Warm days can increase both ice-cream sales and swimming. More swimmers means more exposure to sharks.

The association alone does not show that ice cream causes shark attacks.

Correlation: two quantities vary together.
Causation: changing one produces a change in the other. A correlation alone cannot establish that.

More examples: Tyler Vigen’s Spurious Correlations ↗

03 · Multiple linear regression

Association alone cannot identify the cause

These illustrative sales and attack indices rise together. Inspect the points: can this two-variable scatter tell us whether a third variable drives both?

03 · Multiple linear regression

A common cause can create an association

A confounder is a shared cause that can create or distort the association between a predictor and an outcome.

Higher temperature may affect both ice-cream sales and exposure to swimming. This is a causal hypothesis to investigate.

03 · Multiple linear regression

Adjustment compares cases at the same temperature

SharkAtt=β0+β1IceCreamSales+β2Temp+ε
Without temperature

The ice-cream sales coefficient is the slope multiplying the sales input. It can also capture the shared warm-weather pattern.

With temperature

β1: predicted shark-risk change for +1 sales index, at fixed temperature.
β2: predicted change for +1 temperature index, at fixed sales.

SharkAtt = shark-attack outcome
IceCreamSales = sales predictor.
ε = random response error.
Temp = temperature predictor
β0 = intercept
β1 = ice-cream sales coefficient
β2 = temperature coefficient

Adding temperature changes the comparison: sales is now compared at the same temperature. The coefficient and its uncertainty can both change.

03 · Multiple linear regression

Try the same data with and without temperature

Choose the model. In Sales + temperature, select sales or temperature on X. Shark risk stays on Y.

04 · Assumptions

LINE (1/2): the mean and independent errors

LINE is a memory aid for four assumptions of classical linear regression:
Linearity, Independence, Normality and Equal variance.
They help justify the standard errors and p-values used to judge uncertainty in fitted coefficients.

L · LinearityInput valueResponseMean response

The average response follows a weighted sum of the chosen features.

Intuition: A line describes the middle of the data. Individual observations can sit above or below it.

Why it matters: A missed curve can produce systematically wrong predictions.

I · IndependenceObservation orderError0

The errors of different observations are independent.

Intuition: An error in one case gives no clue about the next. Repeated measurements of one person may break this.

Why it matters: Related errors can make standard errors and p-values misleading.

εi = unobserved error for case i
X = observed feature matrix
E[εi|X]=0: errors average to zero at each input
E denotes the mean over possible errors

Linearity is in the coefficients. Using x² as a feature can still describe a curved mean (x = input).

04 · Assumptions

LINE (2/2): the shape and spread of errors

N describes the shape of the errors. E describes their spread. Both refer to errors at fixed input values.

N · Normality0ErrorMore commonRare

At each input, errors follow a normal, bell-shaped distribution centered at zero.

Intuition: Small positive and negative errors are common. Large errors in either direction are rare.

Why it matters: Together with the other assumptions, this supports exact small-sample t tests.

E · Equal varianceInput valueError0

Errors have the same spread at every input value.

Intuition: Predicting a larger response should not automatically mean a wider cloud of errors.

Why it matters: Unequal spread can make the usual standard errors unreliable.

Var(εi|X)=σε2
σε2 = common error variance
Var = variance, a measure of spread
Equal variance: homoscedasticity
Unequal variance: heteroscedasticity
“Given X” means fixing the observed input values

OLS can fit coefficients without normal errors. LINE supports classical inference about their uncertainty.

04 · Assumptions

Residual plots suggest the next question

PatternPossible concernNext step
Curved mean patternMisspecified conditional meanConsider justified features or transformations
Widening spreadUnequal error varianceInspect scale; use suitable variance modeling or inference
Pattern over time or orderDependent errorsAccount for the sampling or temporal structure
Unusual isolated pointsOutlier or influential observationCheck data quality and sensitivity

A featureless plot does not prove every assumption. A normal Q–Q plot compares residual quantiles with normal-distribution quantiles to assess shape.

04 · Assumptions

A defensible regression workflow

01

Question

Define the outcome, intended use and units.

02

Data

Split cases to match the intended use.

03

Fit

Estimate the coefficients on training data.

04

Check

Compare validation error and residual patterns.

05

Assess

Test the chosen procedure and state assumptions.

Prediction quality, coefficient significance and causal evidence answer different questions.

04 · Assumptions

Reason before calculating

  1. For n training cases, how many coefficients does a degree-5 polynomial have, and what is its full-rank RSE denominator?
  2. Can a correctly calculated model score have negative R² on unseen test observations?
  3. If the feature matrix X has redundant columns, can an ordinary least-squares solution still exist?
  4. Does a slope p-value below 0.05 establish that ice-cream sales cause shark attacks?
n = number of training observations
X = matrix of input features.
OLS = ordinary least squares
RSE = residual standard error.
04 · Assumptions

Explain the distinctions

01 · Parameter count

Six coefficients, including the intercept.
RSE denominator: n − 6, if n > 6 and rank is full.

02 · Baseline

Yes. Its predictions can be worse than the mean-response baseline on that held-out dataset.

03 · Existence

Least squares still has solutions, but coefficients may tie. A pseudoinverse chooses the solution with the smallest coefficient-vector length.

04 · Causality

No. The test concerns association under assumptions. Confounding and study design remain relevant.

n = training count
degree 5 means β0,…,β5.
RSS = model squared-error sum
TSS = mean-baseline squared-error sum.
04 · Assumptions

Fit carefully. Evaluate separately. Interpret precisely.

  • Least squares minimizes squared residuals.
  • Polynomial features remain linear in coefficients.
  • Flexibility can improve fit and amplify instability.
  • Use validation for choices and testing for assessment.
  • Inference needs assumptions; association is not causation.

Next lecture: classification changes the target and the loss.

Sources & further reading

Further reading and practice

Theory and interpretation

An Introduction to Statistical Learning
Chapter 3: linear regression
Penn State STAT 501

Numerical computation

NumPy least squares
Rank, solutions and reliable solvers.

Use the local interactive examples to connect formulas, plots and predictions.

Continue learning
AIML · Lecture 10 · Regression · Part 2
Course home